Drawdown Recovery: Why a 20% Loss Needs 25% Gain to Recover
A 20% loss does not need 20% recovery. It needs 25%.
That small difference is why drawdown becomes dangerous.
Not because the math is complicated.
Because traders usually learn it when they are already under pressure.
Drawdown Recovery Calculator
Use the interactive slider below to select an account drawdown percentage and see the corresponding recovery gain required to get back to breakeven.
Drawdown Recovery Calculator
Why Deeper Losses Escalate Recovery Targets
Most traders think drawdown is just a number on the account.
It is not.
Drawdown changes how you behave.
- At
-5%, you are calm. - At
-10%, you start checking your system. - At
-20%, you start doubting yourself. - At
-30%, you want the money back fast.
That is where traders make the second mistake.
The first mistake was losing capital.
The second mistake is increasing risk because recovery feels too slow.
Imagine your account is ₹1,00,000.
You lose 20%.
Now you have ₹80,000.
To get back to ₹1,00,000, you need ₹20,000 profit. But ₹20,000 on ₹80,000 is not 20%. It is 25%.
That is why drawdown recovery gets harder as the drawdown gets deeper.
A 50% drawdown is even more brutal. If ₹1,00,000 becomes ₹50,000, you need to double the account (a 100% gain) just to get back to breakeven.
This is why professional traders care so much about risk before the loss happens.
Not because they are scared.
Because recovery math is unforgiving.
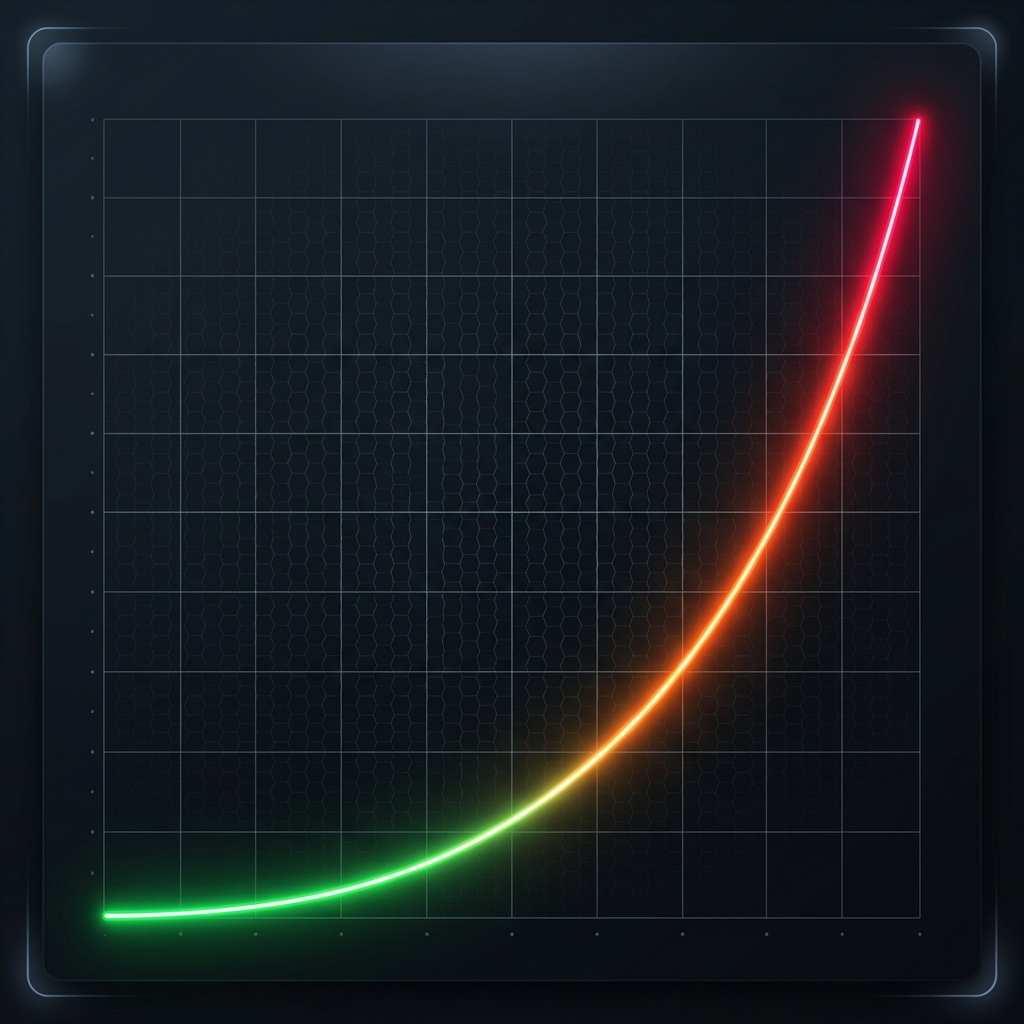
Drawdown vs Recovery Curve
“The deeper the loss, the faster the recovery target rises.”
The hidden danger is behavior after drawdown
Drawdown itself is not always the end.
Many good systems go through losing periods.
The danger is what drawdown does to the trader:
- Position size increases
- Stop loss gets wider
- Lower-quality setups become acceptable
- Journaling stops because reviewing hurts
- One good trade becomes “the recovery trade”
- The trader starts needing money from the market
This is why drawdown must be reviewed as both math and behavior.
Example: Drawdown Audit
Below is a drawdown audit panel showing how tracking risk parameters highlights behavior changes when drawdowns begin.
Example: Drawdown Audit
Telemetry Data & Metrics
The key telemetry insight: “Risk increased after the third consecutive loss.”
Drawdown Audit Checklist
Before trying to recover from a drawdown, step back and answer these questions:
Drawdown Audit Checklist
If the drawdown came from normal losses, reduce size and keep reviewing.
If the drawdown came from rule-breaking, do not change the strategy first. Fix the behavior leak first.
Run this check on your last drawdown.
Do not ask only: “How much did I lose?”
Ask: “What changed in my behavior after I started losing?”
That answer matters more.